Community Corner
How Much Hunger is There in Minnetonka?
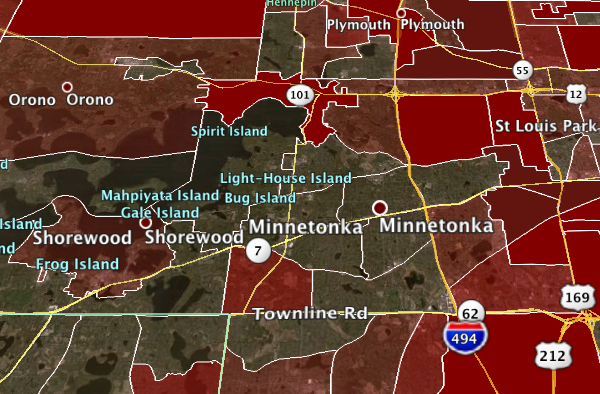
A Hunger-Free Minnesota map highlights the number of missing meals in local neighborhoods.

Combating hunger is an undeniably important goal, but it must be done smartly to make the most of limited resources.
That’s where Hunger-Free Minnesota comes in.
The coalition, founded in March 2010, aims to close Minnesota's gap of 100 million missing meals by 2015. Under the Hunger-Free Minnesota umbrella, business people, community leaders, government policy specialists, faith groups, food banks, food shelves, partner agencies and community members are all doing their part to feed the hungry.
Find out what's happening in Minnetonkawith free, real-time updates from Patch.
A vital part of the group’s strategy is using Census tract-level data to identify the number of missing meals and the available resources in a community. Maps based on this data show concentrations of hunger next to places with few missing meals.
“50 percent of Minnesota’s missing meals are in the Twin Cities Metro area, but they are distributed unevenly in both the urban core and the suburbs. Meanwhile, about 40 percent of Minnesota’s missing meals are missed by rural residents,” a release quoted Ellie Lucas, Hunger-Free Minnesota’s chief campaign officer. “Our grants reflect a mix of local programs and community initiatives that taken together will improve the overall effectiveness of the state’s hunger relief system now and in the future.”
Find out what's happening in Minnetonkawith free, real-time updates from Patch.
Minnetonka is one of the communities to have benefited from those grants. Just last month, Hunger-Free Minnesota named ICA Foodshelf as the recipient of one of its implementation grants.
It’s no surprise why. While most of Minnetonka’s Census tracts have few missing meals, other places in ICA’s service area, such as neighboring Hopkins, are among the worst for metro suburban communities.
The Google Earth map above shows the number of missing meals by Census tract in 2010. It is just a snapshot of what was happening in 2010 based on unemployment, poverty and other factors from that time.
(Some people using mobile browsers may not be able to see the map.)
Each tract was placed in one of four categories—metro urban, metro suburban, non-metro urban or rural—and only compared against other tracts in the same category.
The tracts were then colored one of four shades of red based upon how they compared—again, only in relation to other tracts in their particular category. Tracts with the most missing meals have the darkest red, while tracts with the least have the lightest shade.
The four shades of red equal the following number of missing meals:
Metro Urban Tracts
- Solid Dark Red: 609,631 or more missing meals
- Solid Red: 136,694 to 609,631 missing meals
- Transparent Dark Red: 93,667 to 136,694 missing meals
- Transparent Red: 72,538 to 93,666 missing meals
- No shade: 51,620 to 72,537 missing meals
Metro Suburban Tracts
- Solid Dark Red: 255,077 or more missing meals
- Solid Red: 100,319 to 255,076 missing meals
- Transparent Dark Red: 74,103 to 100,318 missing meals
- Transparent Red: 57,020 to 74,102 missing meals
- No shade: 42,099 to 57,019 missing meals
Non-metro Urban Tracts
- Solid Dark Red: 314,110 or more missing meals
- Solid Red: 126,597 to 314,109 missing meals
- Transparent Dark Red: 87,542 to 126,596 missing meals
- Transparent Red: 67,412 to 87,541 missing meals
- No shade: 50,857 to 67,411 missing meals
Rural Tracts
- Solid Dark Red: 339,579 or more missing meals
- Solid Red: 95,638 to 339,578 missing meals
- Transparent Dark Red: 71,738 to 95,637 missing meals
- Transparent Red: 53,722 to 71,737 missing meals
- No shade: 39,712 to 53,721 missing meals
State Average
- Solid Dark Red: 609,631 or more missing meals
- Solid Red: 105,526 to 609,630 missing meals
- Transparent Dark Red: 77,980 to 105,525 missing meals
- Transparent Red: 59,242 to 77,979 missing meals
- No shade: 42,792 to 59,241 missing meals.
Get more local news delivered straight to your inbox. Sign up for free Patch newsletters and alerts.


